Showing posts with label picture. Show all posts

Wednesday, 30 March 2011

Horseshoe Chaos

While I struggle with supposedly impossible inversions, I'd like to introduce you all to Smale's horseshoe. This object is where the definition of chaos originates yet it is a relatively simple idea.

You start with a square. Squish is down and pull it out to the sides then bend it at the halfway point so it looks like a horseshoe. Then replace it over the square so that the two lengths form vertical strips on the square. This is the basic transformation of the horseshoe map. It is also invertible. Take the bent strips, rotate back to horizontal, and unbend it then squish it in from the sides and pull from the top and bottom then you get the square again. If you do this inversion again you get strips intersection horizontally.

Repeatedly performing the forward transformations you get more and increasingly thin vertical strips: 2 strips become 4, 4 strips become 8 i.e. each strip gets two thinner strips within it at each iteration. Doing the same backwards, you get lots of increasingly thinner horizontal strips. The points in the strips are the points that remain in the set at that iteration. Most points leave after even just a few iterations in either direction.

If you overlay the two directions, the points at the intersections that remain in the square under all iterations (if you iterate infinitely in either direction). This is the invariant set. This set is a Cantor set (disconnected and unstable fractal).

If you labelled each point with 0 or 1 at each iteration you could describe the positions of all the points in the square e.g. .0101 means a point that is in the 6th vertical strip after four iterations (the right hand strip of the left hand strip of the right hand strip of the left hand strip in the first iteration) or
If you can see that...sorry if it's too small.

Since you can do this in both directions, the whole dynamics of any point in the square can be described by it's bi-infinite sequence of positions.
Knowing this we can construct any orbit we like and we know it will describe at least one point in the square.
So we can make a periodic point: ...010101.0101010... which alternates from the left to the right. Since we have infinite lengths in both direction, we can make (uncountably) infinitely many of these periodic points.
Or we can make a non-periodic point: ...010001101100000.1010100110111... by, for example, 'counting' in binary as above or just by adding the wrong value to a periodic point i.e. ...01010101.0101011...is non-periodic. There are (uncountably) infinite of these too.
Among this set of non-periodic orbits we can find at least one that comes arbitrarily close to the invariant set. This is trivial since you can take just part of the sequence that describes a point in the invariant set and it would come as close as you like!

I hope you are following since I have just demonstrated that Smale's horseshoe perfectly defines chaos.
Chaotic motion must consist of the following:
- infinitely many periodic orbits
- non-periodic orbits
- dense orbits - ones that come arbitrarily close to any point in the set.
There tends also to be the condition of sensitive dependence on initial conditions but this can be shown through the dense orbits - you can take two sequences that are the same for any arbitrary iterations and in the next they can end up in two different strips i.e. they may start very close but can end up very far apart.

Voila!

Strogatz does give a very basic introduction but for a more detailed approach read the first chapter of "Elements of Applied Bifurcation Theory" by Yuri Kuznetsov. Wiki also has its own explanation.

Monday, 21 March 2011

How many drafts...?!

So here we are, nearing the end of my project. Well, actually there are six weeks left til I hand in my thesis but it doesn't feel like it. It feels more like two. :S

I've been asked to do two drafts already. A third one is coming up next week and I'll redo the current one into a fourth. After that they combine into a fifth. Then will follow a sixth from recommended improvements. I'll probably create another couple just for kicks! So that's at leasts one a week...a draft roughly for each month I've worked on it. I'm drowning in them!!

Ah well, at least it means I have shiny pictures for you this week. My draft task this week was to tell the story of one side of my research (decreasing lambda) as purely in images as possible. Obviously the details will be missing but I hope you enjoy the obvious progression and changes in images as lambda varies.
My image report draft is available here.

In other parts of my Masters world I am winding down on lectures and winding up for revision ready for exams in nine weeks. I want to try something new for my revision this year - sort of step it up a level. If anyone has any recommendations that would be very welcome. I have a few ideas but would like to augment these with other influences.

 I also have to produce a poster and a website for my Masters project but I'll share them here first to get opinions! I will of course add a link to this blog in my website (cheeky I know!); maybe they'll give me extra marks for initiative and knowledge sharing never mind the pretty pictures!

Saturday, 5 February 2011

Weird Manifolds

So this week, I've been using the new software (which is working well now) to calculate the invariant manifolds of the map I've been researching. The best way to think of manifolds are the shapes/curves that the system points hop around on as they iterate under the mapping. There has to be saddle points in the system in order that the stable and unstable manifolds can cross and then be calculated. The calculation to find the manifolds requires tracking backwards in time the path of the saddle point...which shouldn't be possible in a noninvertible system. This is where the weird stuff comes in especially in the case for my map.

For some points, there are no points to track back to or four and for all others there are two possible previous values. Currently the software can calculate two possible values and then for each carries on the path back taking either the 'positive' or 'negative' - whichever is the most likely to be the previous value. It does factor in the no pre-images case but not yet the four possible values. That is part of the work I still have to do this year.

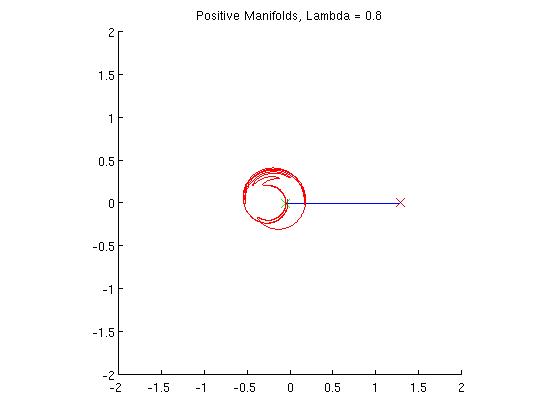
It helps to see some images so here are some I calculated just this week!!


The red line is the unstable manifold and the blue is the stable. The point where they cross is a saddle point in the system and the other cross is the repelling point. I've only shown the positive manifolds (one side of the possible previous values) but the negative manifolds are just the reflection in the x-axis.

Sunday, 23 January 2011

Pwetty Pictures and a Presentation

So, this week when I thought about what to blog I left it pretty last minute. This means that instead of an (usually very interesting) insight into chaos I will share with you the presentation I gave on Friday for my project to students and lecturers. I have left the notes attached so you can follow what I spoke about as well.

One moment from someone else's presentation I would like to share is this:


Brilliant!!

The presentation itself was about business intelligence which does not really interest me but the image brought some light humour to the talk. 

Saturday, 15 January 2011

Nonlinearity gets all the fun

Nonlinearity is inherent in most systems before you make an assumption and reduce the beautiful complexity down to a boring bog standard linear system. There is a section in Strogatz that shows probably the most interesting thing you can do with linear systems (Chapter 5 section 3 page 138 onwards). And I only read it once because linear systems were dull and pretty repetitive long before A level.

Nonlinearity is pretty easy to understand. Take for example square numbers. You can make 4 by either multiplying 2 and 2 or -2 and -2. This means that, under the square operator, 4 has two (well, four really, but two are identical to the other two) possible previous values. This makes squaring a number nonlinear because tracking back you do not know whether two 2s or two -2s made the 4 you see at the moment. This particular brand of nonlinearity is called noninvertibility. You still following me?

Good. Right, to take this further we call the previous values of each number pre-images and the operation, a mapping. Now the quadratic (squaring) mapping that I am examining is:


what happens to z when a=2 and I vary lambda. This mapping does funny things depending on what I set lambda to. If it is between 0 and 1 then it behaves just like the squaring operator - each value of z has two pre-images as I iterate the map but in a circle radius=1-lambda around C the values have no pre-images. Now if I make lambda greater than 1, some values have two pre-images as before but the z values in the circle now have four pre-images.

Still with me? We can take this further but placing this property on curves not just points. A curve is just a line on a graph (an infinite set of points). Instead of looking backwards as we did with the points, we instead go forwards and see how the curve changes. It's first image is a circle, say. This curve then becomes the pre-image of the set of points of the circle under the mapping. And so on, forwards in time. It helps to look at the image below:
You can see the curves collecting on (heading towards) one curve called a manifold (it's attracting). Now consider the relationship of the points and the curves. Because a curve is just a set of points. With noninvertibility inherent in the system, what happens it you take the manifold and reverse the mappings for all the points? Wild Chaos! Tracking the possible points and curves and how and why they interact is the next stage of my project - at least for certain ranges of values for C, a and lambda. This limitation is purely because my project has a time limit of a year.

I am currently working with a PhD student, Stefanie Hittmeyer (who incidentally produced the image above) who is working on the full problem in all its scope. She has been focused on the manifold part of it for the moment while I have been examining the fractal structure side. My work nicely compliments hers. This work is on the fore-front of chaos research. Now it may seem that all this has little value in the real world but the great thing about nonlinear and chaotic systems is that it can accurately mimic real world systems. This is a major advantage over linear systems because when taking a real world problem you have to reduce the picture you are looking at so you can describe it using the simplest tools. With this kind of research, no such reduction is necessary and you can understand the system in it's full complexity. So maybe it'll turn out that neurological signals in the brain will turn out to have similar properties to the mapping that I am examining and my research will contribute to a fuller understanding of how we came to have consciousness and help neurosurgeons get better at fixing the biochemical circuitry that makes us who we are. Or maybe, and more likely since this mapping is a reduction of the five dimensional Lorenz model, it will just help meteorologists get really, really good at predicting weather patterns.

Who knows? It's sort of like the laser - a solution created with no problem that has now become integral to our lifestyle. Just check out how many things it is used in! I hope you managed to follow all that to the end. If you have any specific questions please feel free to email me but I would much rather you follow that urge to take a deeper look yourself (even if that is just reading all the wiki pages). It's way more fun!

Saturday, 8 January 2011

Oh, a promise

I also promised a friend I would post a picture up this week so here it is:

This is from the edge of the Mandelbrot set - originally from Wikipedia
And an example from my own research will be uploaded next week.